This is the analysis of Merger Arbitrage Spread Performance April 7, 2019. This reports covers the top 20 investable US cash based merger arbitrage spreads for the week 1st – 5th April. We produce this report at the end of each week. Firstly, the analysis discusses the biggest winners & losers from the portfolio. Secondly, we highlight the performance of the portfolio and conclude with the broader market as a point of comparison. The information contained in this weekly analysis and review assists traders in their merger arbitrage investment decision making.
In this report, Merger Arbitrage Limited reviews a selection of merger and acquisition deals from the T20 Portfolio. A list of pending cash merger arbitrage spreads available as at 31st March. Investors and traders can follow our latest Top 20 (T20) list each week here. Regular followers will already be familiar with our rules for inclusion on the T20 Portfolio. Click this link for the spread performance analysis from the previous week.
Merger Arbitrage Spread Performance April 7, 2019
Winners
- The significant gainer this week from the T20 list was Bluegreen Vacations Corporation (BXG). The stock climbed a 3.90% to close the week at $15.44. There was no news announced during the week so we can assume the rebound was due to the previous week’s collapse regarding the statement from Bass Pro. As per the T20 rules, we do not include stocks trading at a premium in the portfolio. Therefore we were able to avoid the losses incurred following this statement but the portfolio does benefit from the gains this week as the stock was at a discount to the $16.00 offer price. The spread currently stands at 4.78%. A dividend of $0.17 is expected to be paid at the end of next month.
- WABCO Holdings (WBC) was the other significant gainer this week rising 0.90% to $133.02. This spread was already looking narrow on an annualised basis so it was somewhat surprising to see the stock move by so much so early on in the deal process. The spread now stands at only 2.62% for a deal expected to close in early 2020. Clearly traders are expecting early closure of this deal but with the spread this tight so early on we are in no rush to make an investment here.
Losers
Spark Therapeutics (ONCE)
This week’s worst performer was Spark Therapeutics (ONCE). The stock declined 1.15% or $1.31. The spread now stands at 1.71% for a tender offer that was originally expected to close April 2nd. However, with only 29.4% of the stock tendered, Roche has extended the offer until May 2nd. This caused the stock to fall and it appears traders are not speculating on a higher bid forthcoming to sweeten the deal following Roche comment on the issue “All terms and conditions of the offer shall remain unchanged during the extended period“. In addition to this Roche has also withdrawn and refiled the Premerger Notification and Report Form under the HSR act effective as of April 2nd and is expected to refile on or about April 10th. As this is a tender offer, the waiting period will expire on the 25th April.
Quantenna Communications (QTNA)
Quantenna Communications (QTNA) was another loser of note this week down 0.78% or $0.19. For a recently announced deal this spread very quickly moved towards the offer price of $25.00 and at the start of the week the spread had come into 0.70%. Following this week’s decline that has now widened to 1.49%. There was no significant news of regulatory filings this week for this stock. We are assuming this move was some profit taking as the spread had become too tight.
Pacific Biosciences of California (PACB)
Pacific Biosciences of California (PACB) continues it’s wild ride. Although the stock only moved $0.03 lower for the week we have mentioned it because of the inter-week volatility. Once again there was no news that caused the movement and it appears that general market fluctuations were the primary driver. This continues to suit our previous stated strategy perfectly. During the week we were able to make a round trip (exiting & reentering our position). On Friday the stock traded as high as $7.42 and as low as $7.23. We will, as always continue to trade the volatility of this spread.
Portfolio Performance
We’ve previously added some supplementary information
- The standard deviation of returns for the top 20 in addition to the average return. This gives our readers a better idea as to the movement within the portfolio.
- The change in the VIX (relative percent) is also included as a complimentary figure to the performance of the SPY
Winners comfortably beat out the losers this week by a margin of 15 winners to 5 loser5 and 0 non-movers. The portfolio consisted of 20 stock and 0 cash positions. The portfolio showed a positive performance and finished the week up by 0.24%. The gain this week was mainly due to the performance of BXG which gained 8.82%. The preceding fall of BXG in the prior week which enabled the recovery this was not recorded in the performance of the T20 because at the time the spread was trading at a premium. This shows the difficulties in speculating on acquires raising their offers. The standard deviation of the returns is 0.98%. This is significantly higher than in recent times and above the longer term average level. The main reason was the deviation in return from BXG on the positive side to ONCE on the negative side.
Market Performance
The MNA ETF returned another positive performance, this time a significantly positive 1.01%. This gain has all but reversed the losses suffered in recent week due to the exposure on the long side. This once again shows the shortcoming of investing in this particular product. See our Merger Arbitrage ETF Review for more information. The S&P 500 ETF, SPY also showed significant gains throughout the week and finished up 3.30%. Unsurprisingly, following such a dramatic gain in the broader market, the VIX index decreased by 22.21%.
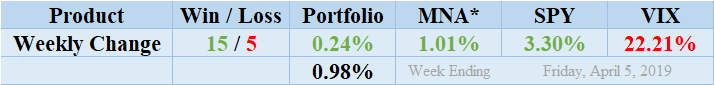
MNA SPY VIX Returns Table 20190405
*We have not included MRGR ETF for liquidity reasons. Click the table to read our Merger Arbitrage ETF Review and see a discussion of how liquidity and other factors affect the performance of these products.
The most recent list of the largest spreads is already available. Our free merger arbitrage spread calculator is also available for FREE download. This can be used to value the spread of any stock-for-stock deals you may be interested in.