This is the analysis of Merger Arbitrage Spread Performance April 14, 2019. This reports covers the top 20 investable US cash based merger arbitrage spreads for the week 8th – 12th April. We produce this report at the end of each week. Firstly, the analysis discusses the biggest winners & losers from the portfolio. Secondly, we highlight the performance of the portfolio and conclude with the broader market as a point of comparison. The information contained in this weekly analysis and review assists traders in their merger arbitrage investment decision making.
In this report, Merger Arbitrage Limited reviews a selection of merger and acquisition deals from the T20 Portfolio. A list of pending cash merger arbitrage spreads available as at 7th April. Investors and traders can follow our latest Top 20 (T20) list each week here. Regular followers will already be familiar with our rules for inclusion on the T20 Portfolio. Click this link for the spread performance analysis from the previous week.
Merger Arbitrage Spread Performance April 14, 2019
Winners
- Pacific Biosciences of California (PACB) was the biggest gainer this week. The stock climbed 1.52% or $0.11 to $7.37. Once again there was no deal news but the stock continued it volatile ride. This continues to suit our previous stated strategy perfectly. During the week we were able to exit a little more of our position. We will, as always continue to trade the volatility of this spread.
- Nightstar Therapeutics (NITE) was the second best performer. The stock finished the week up 0.79% and now trades at parity to the offer price of $25.50 from Biogen. During the week a “Scheme Document” was made available to NITE shareholders outlining the terms and particulars of the deal. A shareholder meeting is to take place on May 8th where shareholders are overwhelming expected to vote in favour of the deal.
- The last best performer this week of note was American Midstream (AMID) which increased 0.58% to $5.18. The low price of this stock barely makes it eligible for our list as per the rules. An increase of only $0.03 for the week makes it difficult to make a profit once commissions and bid-offer spreads are considered.
Losers
- This week’s worst performer was Spark Therapeutics (ONCE). The stock declined an additional 1.29% or $1.45 following last week’s decline of 1.15%. The spread now stands at 3.04% for a tender offer that was originally expected to close April 2nd. However, with only 29.4% of the stock tendered, Roche has extended the offer until May 2nd. This low take up of the tender offer continues to weigh on the stock. A prior comment from Roche, “All terms and conditions of the offer shall remain unchanged during the extended period” has clearly not inspired traders to speculate on a higher bid forthcoming. In addition to this, Roche has also withdrawn and refiled the Premerger Notification and Report Form under the HSR act effective as of April 2nd. They were expected to refile on or about April 10th. As this is a tender offer, the waiting period will expire on the 15 days later.
- The second worst performer this week was Redhat (RHT) which increased 0.48% to $182.37. The last news regarding this deal was a report that CTFN sources claim Redhat are working with the Department of Justice to establish a time line for the deal. The stock continues to fluctuate according to market movement but the main factor governing the size of the spread is the expected timeframe of completion.
Portfolio Performance
Winners once again comfortably beat out the losers this week by a margin of 12 winners to 7 losers and 1 non-mover. The portfolio consisted of 20 stock and 0 cash positions. The portfolio showed a positive performance and finished the week up by 0.09%. The gain this week was primarily due to the performance of PACB which gained 1.52%. This continues the fluctuations experienced in recent times by this stock. With little news regarding the deal last week’s fall has merely created the opportunity for traders to pick up some stock at an attractive price. The standard deviation of the returns is 0.53%. This is significantly lower than in recent times and marginally lower than the longer term average level. There were only two movers from the list with returns greater than 1%.
Market Performance
The MNA ETF reversed last week’s positive performance. This time a showing significantly negative 0.69%. This loss has not quite reversed the gains made in the last two weeks but does bring that recovery to a screeching halt. This volatility once again shows the shortcoming of investing in this particular product. See our Merger Arbitrage ETF Review for more information. The S&P 500 ETF, SPY also showed significant gains throughout the week and finished up 0.54%. Unsurprisingly, following another gain in the broader market, the VIX index also decreased again by 6.32%.
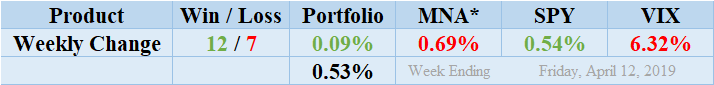
MNA SPY VIX Returns Table 20190412
*We have not included MRGR ETF for liquidity reasons. Click the table to read our Merger Arbitrage ETF Review and see a discussion of how liquidity and other factors affect the performance of these products.
The most recent list of the largest spreads is already available. Our free merger arbitrage spread calculator is also available for FREE download. This can be used to value the spread of any stock-for-stock deals you may be interested in.