The Price Earnings Ratio is a company valuation metric. It is also referred to as the P/E, P/E Ratio, PER, PE Ratio, P to E ratio or P/E multiple amongst others. The Price to Earnings Ratio is a measure designed to help investors determine the market value of a stock in relation to its earnings per share (EPS). In short, the P/E ratio is the price an investor is willing to pay for $1 of a company’s earnings or profit. It is a popular ratio and one of the most widely used stock analysis tools in investing. On its own, the figure can be widely misinterpreted but is able to give a sense of comparative value when used in conjunction with an appropriate benchmark. Comparisons made with the average P/E ratio of the S&P 500 Index, currently at 15.78, is a common practice as these constituents are well known, liquid and audited companies. Similar stocks in the same industry as the target P/E are also common forms of comparisons.
P/E Ratio of the S&P 500
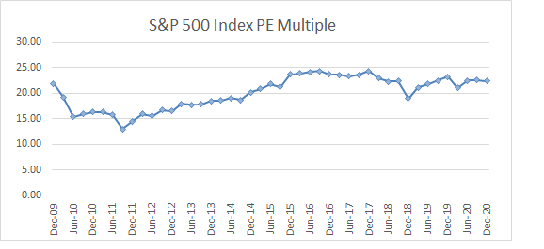
The time series of the S&P 500 Index PE multiple itself is also a frequently referred to statistic. The P/E is often a weighted average of the index members in accordance with the market capitalization weighting. Over time, the multiple displays readings such as market observers begin to suggest the broader market is becoming overbought or oversold. Although using this tool as a trading guide is far from perfect, it can demonstrate the current positon of the market / economy in a broader historical perspective. The graph below (using data from S&P Global) shows the S&P 500 Index P/E Multiple through until the end of 2020. This previously forecasted level however is unlikely to be achieved in light of the COVID-19 pandemic.
What Price Earnings Ratio is good?
Investors often ask this question and unfortunately is difficult to answer as the context of the number must be taken into consideration. The Price Earnings Ratio is used for valuing companies and to find out whether they are overvalued or undervalued. If a company is reporting basic or diluted earnings per share of $5 and the stock is selling for $50 per share, the p/e ratio is 10. The stock price of $50 per share, divided by $5 earnings per share. A higher EPS ratio can indicate a company’s ability to generate large profits for common shareholders. This in turn will lead to a lower p/e ratio. In this instance, the stock may be perceived as cheap. If the stock price has declined sharply however for some reason, this may also give a lower p/e ratio. But as the stock decline might suggest there are wider problems in the firm, the stock may be viewed as expensive.
Formula for the PE Ratio
To calculate the ratio we use the Price Earnings Ratio formula given below. If the Earnings per Share (EPS) is not already known this must be calculated first and inserted into the formula
How is the Price Earnings Ratio Calculated?
Stock Price / Earnings Per Share = Price Earnings Ratio
Earnings Per Share = EBITDA / Number of Shares in issuance
Immediately, the inputs in the above equations open the door to wide ranging subjectivity. To begin with, EBITDA can be massaged in a number of ways and can of course vary across different geographical regions. This could be a forecast number or a historical (trailing) figure depending on the analysis being made. Shares in issuance can refer to the number shares given as the free float number or may include stock with is privately held. It may, or may not include upcoming dilutions during a forthcoming time period. This inclusion should be coordinated with the choice of earnings (forecasted or historical) as referred to above. It is therefore wise for the trader to check the source and calculation of the figures before making any investment decision.
Using the Price Earnings Ratio in Mergers and Acquisitions
When attempting to assess the value of a deal it is commonplace to compare the target firm to similar deals in the same industry. The Price Earnings Ratio lends itself to this type of analysis. Traders can compare the ratio across deals to gauge if the valuation is high or low. This may provide clues as to whether a rival bid is possible and in turn a bidding war. Especially if a rival is able to extract greater synergies from the deal. This may help explain anomolies in the merger arbitrage spread if applicable.
Often times, this level of analysis would have been completed by the investment banking firm representing the target firm. The board of directors, in carrying out their fiduciary responsibilities will also be aware of this valuation exercise and use it in conjunction with management, when discussing the final offer price with the acquirer if necessary.